The concept of a ‘bicycle account’ – a regular, holistic review of where a city is, in terms of getting people riding – was created in cities like Copenhagen. The idea is that assessing the health of cycling and cycling conditions goes beyond simple rider numbers, as important as these are (and it’s great to see we are also getting much better at counting those).
Beyond bike trip numbers, a bicycle account also branches out into other matters that are quantifiable, provides case studies and examples of improvements, and presents the whole story in a report format easily accessible for all of us (including time-poor decision-makers who need a quick snapshot of where things are at).
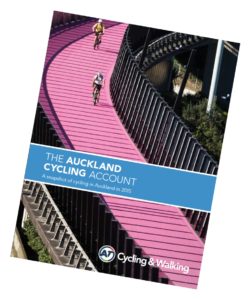
The Auckland Bicycle Account 2015 (read it here) reports on a number of things, among them:
- The widespread support cycling receives in Council funding submissions
- The reasons Aucklanders ride – and why many still don’t
- How many of Auckland’s riders are women (higher percentages are an indicator of safe conditions)
- How safe riders feel on some of our new cycleways (as gleaned from surveys and interviews)
If you’re interested in the more detailed background references, you can find them here.
Of course, we have some distance to ride before we get to the kind of comprehensive bike-friendliness and comprehensive reporting of places like Copenhagen (here’s their 2014 example). But as Janette Sadik-Khan and others have said in various ways – what gets measured, gets improved.
So what would you like to see measured more, or measured in more detail, in the next Bicycle Account in 2016? It may be too early to start surveying cargo bikes, say – but maybe some stats on the $$$ savings per km travelled by bike, as in Copenhagen’s example, would be useful?


