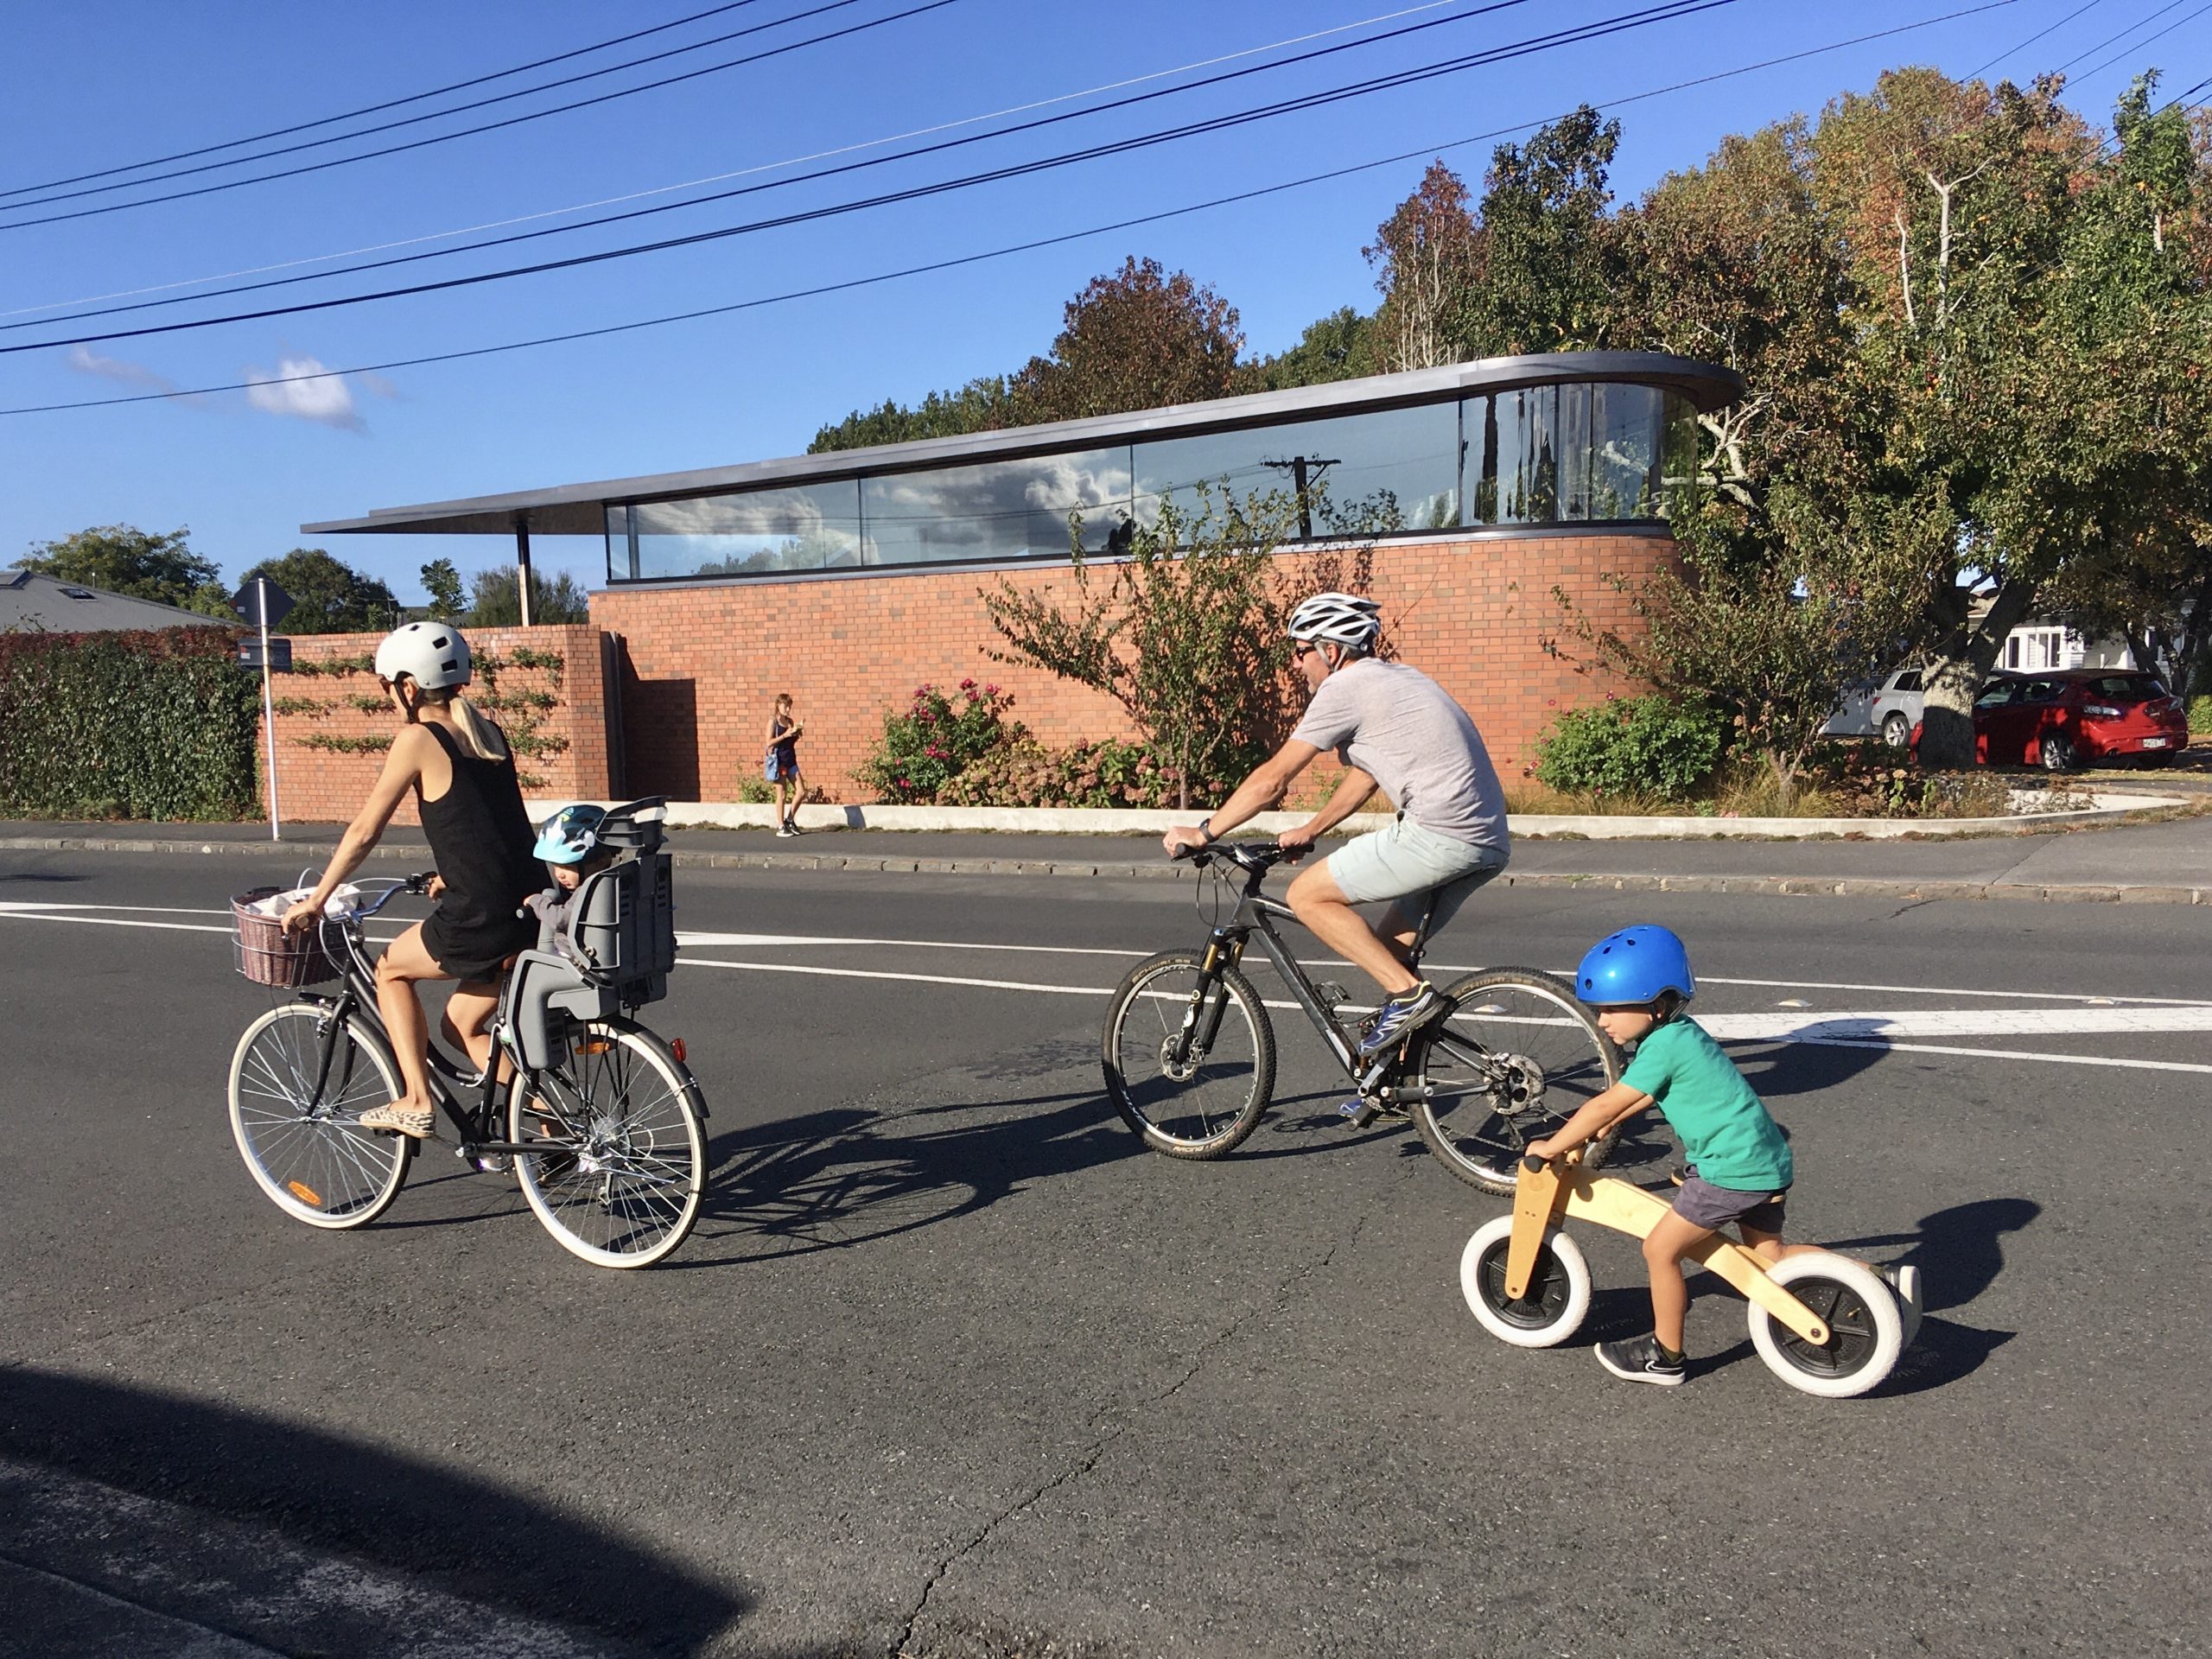
As New Zealanders settled into the sudden and dramatic quiet of Level 4 lockdown, a squeaky noise could be heard. It was the hinges of shed doors opening, and the turning of pedals, as people reached for and jumped on their bikes.
Whether it was getting out of the house for fresh air, or heading out for exercise while staying local, pretty much overnight, bikes became the easy and attractive option for everyday Aucklanders.
Simultaneously, we heard from you that without constant and heavy vehicle traffic, your streets suddenly felt stress-free. And from our bubbles all over the city, we saw all kinds of fresh faces taking to the streets by bike – from tinies on balance bikes, through to the pootling newbie e-bikers, and everything in between.
The phenomenon made the news, as reported by Rebecca Moore for OneNews and RNZ’s Harry Lock and Michael Neilson in the Herald.
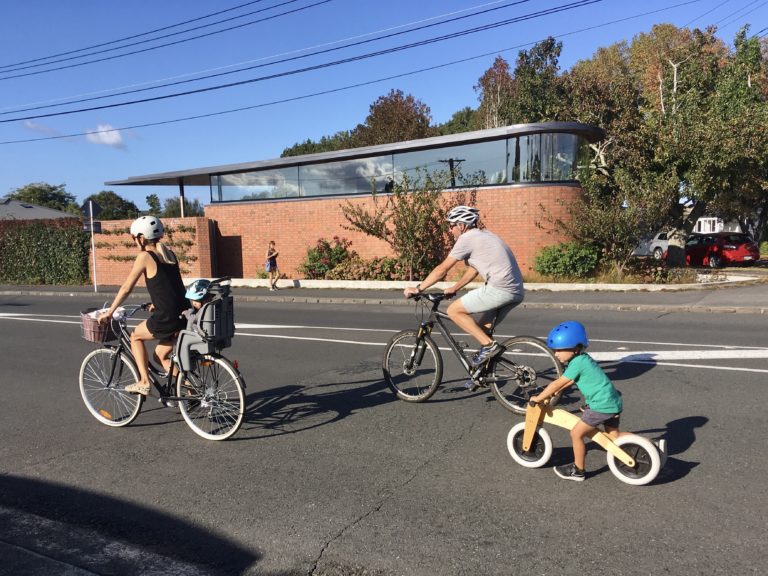
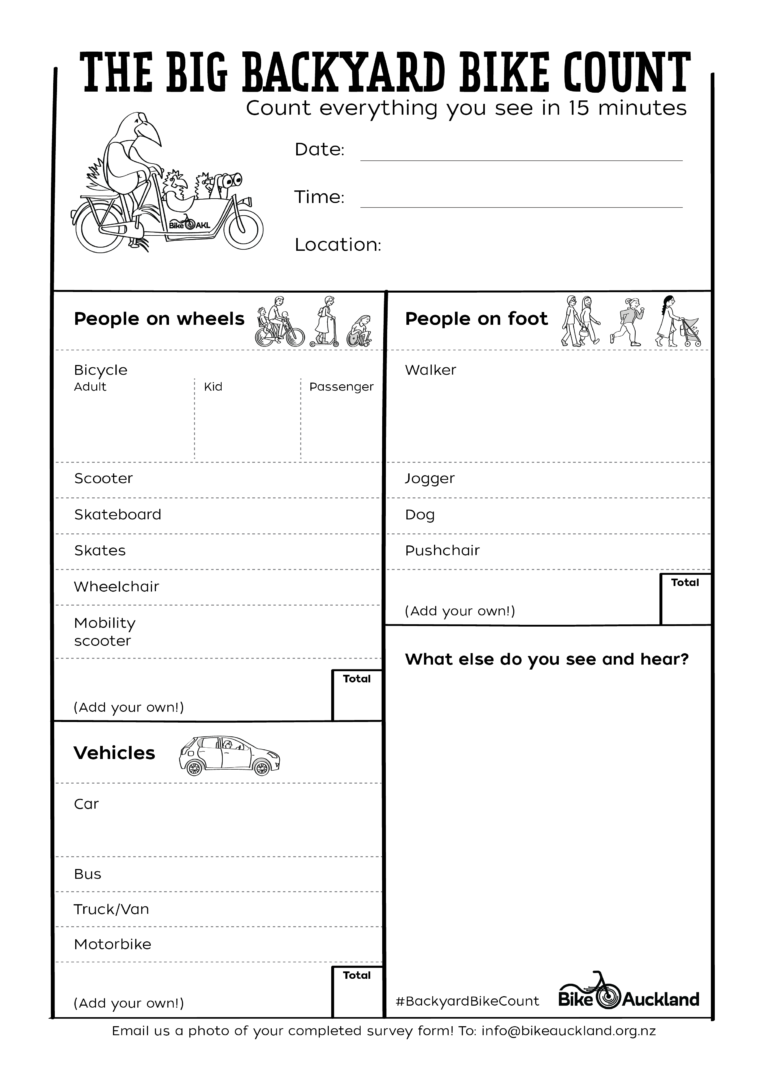
That’s why, two weeks into lockdown, on 11 April we launched the Big Backyard Bike Count. Our invitation: help us capture this moment in time, and gather some much needed data on local trips to fill the gaps in the official information.
We were so excited when the first few entries came rolling in, and so grateful that people were taking 15 minutes out of their day to help us paint a picture of Auckland on wheels. We could never have expected the huge uptake that we’ve seen: a month into the Big Backyard Bike Count, we’ve had surveys from more than 250 locations, and 20,000 recorded movements all over the city.


What we’re already seeing
In the three and a half weeks the Backyard Bike Count has been running, you’ve helped create a historic and unprecedented picture of local biking across Auckland – and started to fill the gaps between Auckland Transport’s 26 official cycleway counters.
We’re hard at work crunching the numbers, and entries are still coming in daily through Level 3.
The preliminary data tells an amazing story of a city that, for a moment in time, lived and travelled locally predominantly by foot and by bike. Here are a few initial highlights:
- Across Auckland, the average share on the street was 19% people on wheels, 42% people on feet, and 39% vehicles. A giant leap away from the usual mode share!
- We’re seeing hotspots across the city where bikes are booming, with the central and western suburbs showing record numbers, as well as well known favourites like Tamaki Drive recording hundreds of people on bikes in a 15-minute window. (That’s multiple hundreds per hour – no wonder it’s top of the list for AT’s rollout of emergency extra space for safe walking and biking!)
- As the data continues to come in, we are noticing a change in gears: bike numbers staying roughly the same for now, but some of those pedestrian trips are turning into car trips as people return to work and old habits.

What can we do with this data?

The question is: how can we use what we’ve learned during lockdown? What actions can we take to help lock in these changes? And protect the people who plan to keep biking?
The data we’ve gathered so far is really helpful – above all, because it demonstrates at a large scale the immense untapped demand for local stress-free riding.
We’ve heard for some time that 60% of Aucklanders say they would cycle more if it felt safer. Now we have the evidence that when it’s safe, people love to ride. We can also see how easily bikeable our immediate neighbourhoods can be.
Bike Auckland has been pushing for safer local streets for years (over two decades, in fact!). Whenever we speak to Local Boards, AT, Councillors and other partners around the city, we ask them to imagine a world where speeds are safe, infrastructure is aplenty and people feel safe to ride where they live, to work, to the shops and for fun.
After Level 4, we no longer need to ask people to imagine it: they’ve lived it and felt it. The Bike Count gives us the data to back up that feeling, in a push for the quick delivery of safe space.
We now have proof of concept, proof of demand, proof of potential – great things to have as emergency responses are rolled out, and Auckland works on its list of Innovating Streets projects.

We’re still counting on you, so by all means keep counting!
We continue to welcome your Backyard Bike Counts this week. As you can see from the map above, there are still areas that we have no visibility over – so if you don’t see your ‘hood counted, it would be great to get out there and record what you see.
So, do keep counting through Level 3!
Click here for the form Backyard-Bike-Count-Survey-v2 or you can click the photo version at the bottom of this post to enlarge it and print it. Don’t have a printer at home? Just copy the categories onto your own piece of paper. And remember to send a photo to info@baklstaging.wpengine.com when you’ve completed your survey!
We’ll close off the count when we enter Level 2, so there’s a chance that this is the last weekend to get out and make a record of this slightly different world.
Photos and video are also extremely welcome, especially if you’re encountering or experiencing the sort of bike journeys that are new to your neighbourhood. You can send them to us any time.
Thank you so much to the hundreds of you who’ve sent in entries so far, and the many hours of your time you’ve put into helping us tell this story. We knew we could count on you to help build a more bikeable Auckland!

