The July bike data is out, and even allowing for the usual winter dip, there are some dramatic developments. As with the June data, the ‘if you build it’ effect continues – cycleways that have been recently built, upgraded or hooked into the network are seeing more riders than this time last year.
Conversely, on routes that are, shall we say, ‘under-loved’ (infrastructurally speaking), existing riders are hanging in there – but newbies aren’t showing up in droves. It’s not rocket science.
By all means dig into the numbers and tell us what you see: as always, you can find the raw data on AT’s website. We’ve been graphing them too (full set of plots available here). Below, we take a quick look at a few interesting examples.
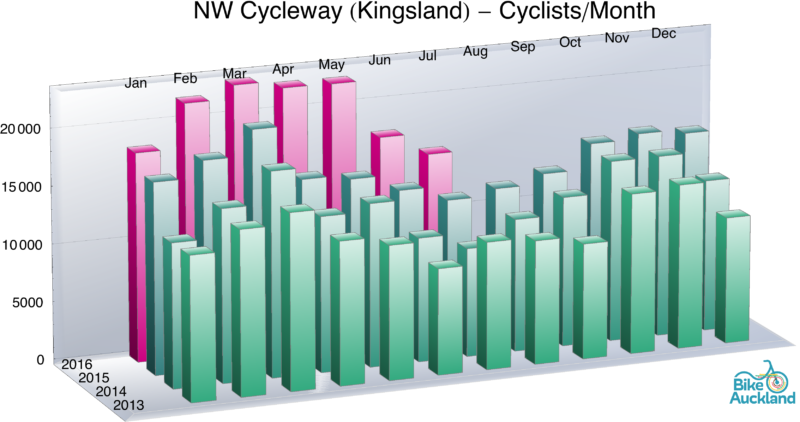
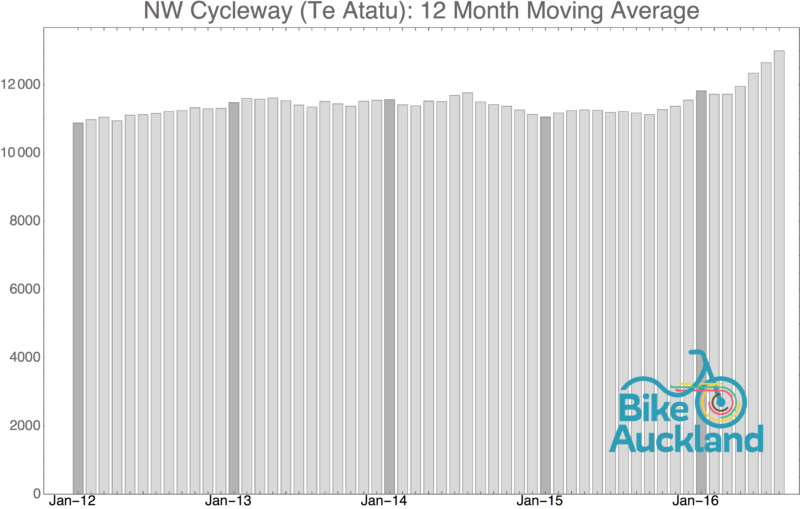
Out along the well-connected west, ridership on the NW cycleway continues to boom. Even with the winter dip, this is eye-catching stuff: the 2016 winter low at Kingsland beats the high point of 2013. BOOYAH!
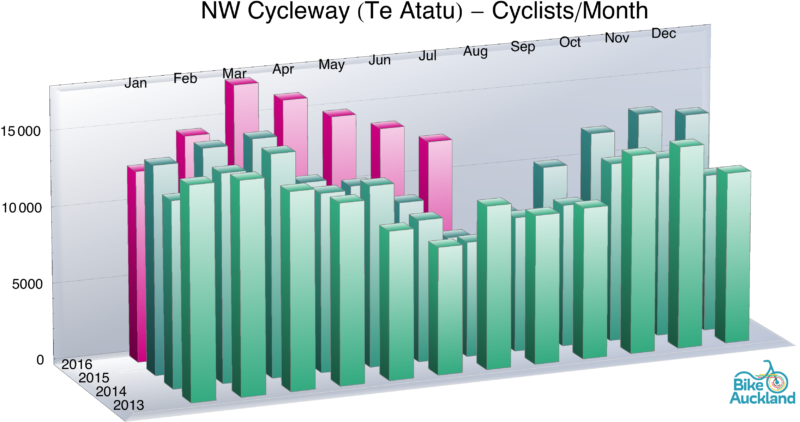
And look at Te Atatu. which is where a good chunk of this bike traffic is now coming from. Hard out! This year’s low is giving last year’s high a run for its money! Westies represent!
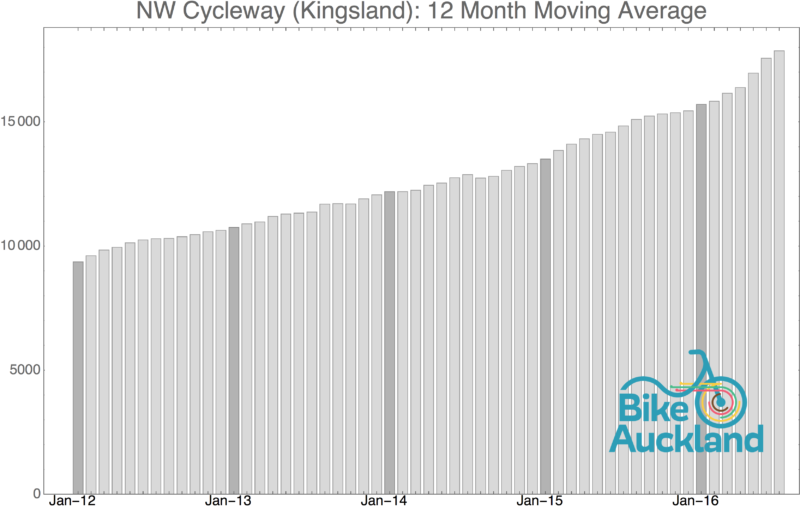
Here are those numbers as rolling twelve-month averages, so you can see the cumulative growth. The Kingsland counter climbs even more steeply than ever; and Te Atatu gets a big fat tick.
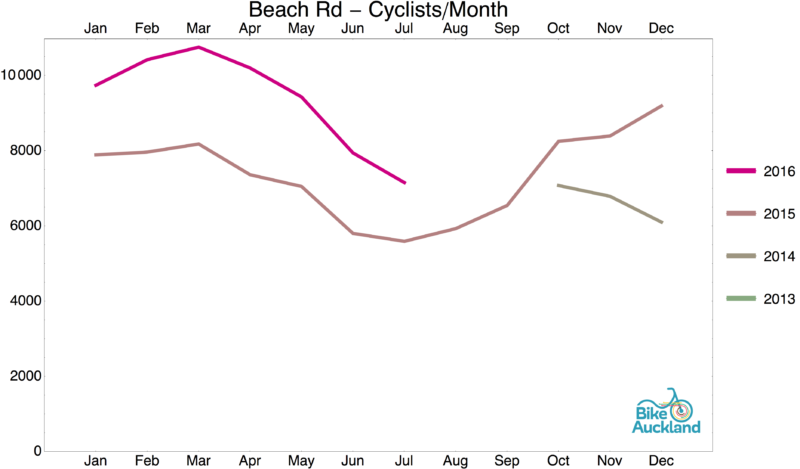
Confirming the central city network effect, Beach Rd and Grafton Gully (both approaching their second birthday!) continue to grow relative to last year, even with the winter dip.
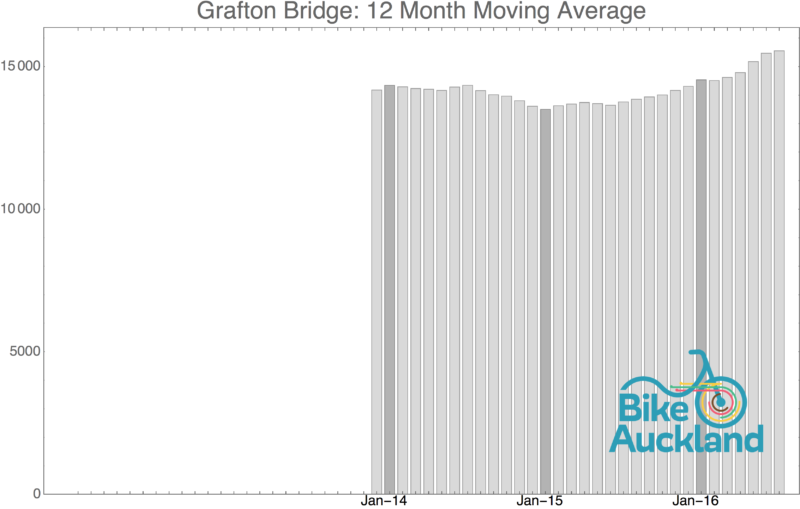
And even the resolutely unimproved Grafton Bridge bears solid witness to the growth in city cycling:
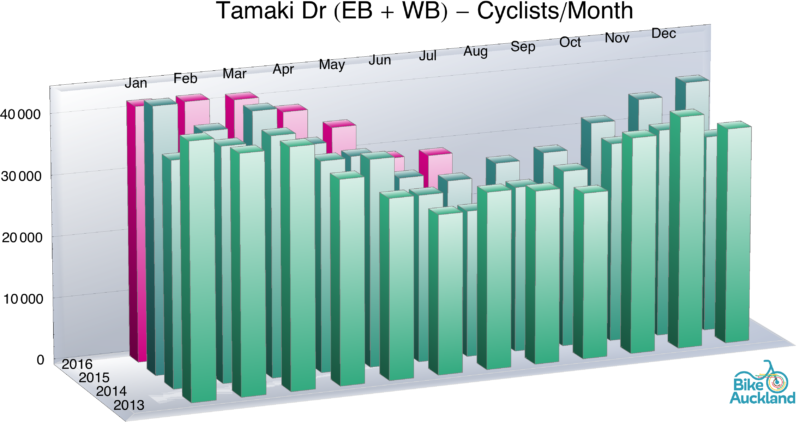
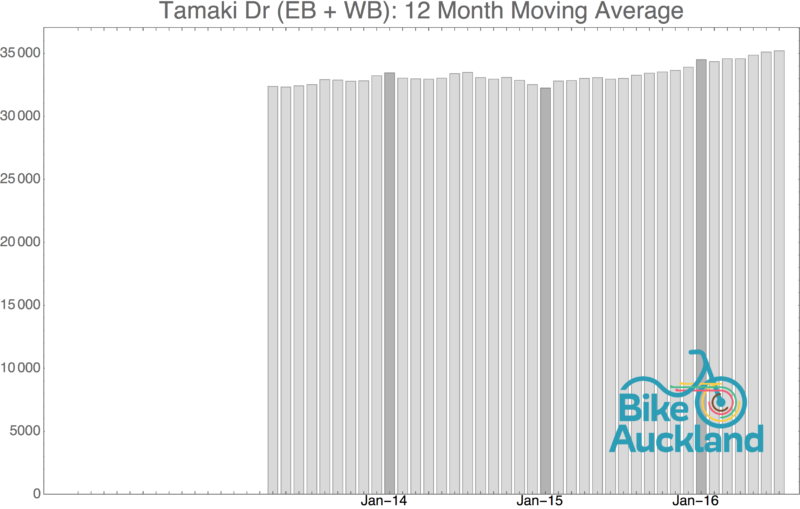
Meanwhile, the busiest route in town, Tamaki Drive, continues to edge upwards. Even though this premier route isn’t exactly gold-plated, it’s still the major option for people travelling from the east into town, as well as a leisure attraction whatever the weather. Interesting to contemplate how much busier it might be if it were given the royal treatment. (NB the construction of interim improvements at Ngapipi Rd were delayed by weather conditions and are now scheduled for next week).
Here’s monthly volumes on Tamaki Drive for the last four years:
And here’s your rolling average:
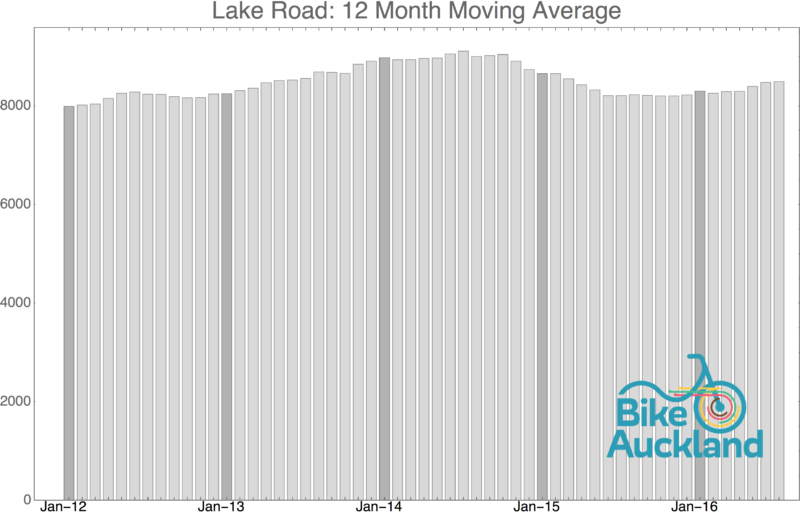
Right. That’s the good news. Now, want to see what it looks like when nothing much changes? Even in the midst of some of the most active and creative local bike groups and the highest bike-to-school numbers in the city? It looks a bit like this. (NB Lake Rd has been chosen simply by way of example – we could have picked any unimproved route in a bike-enthusiastic part of town, for similar effect).
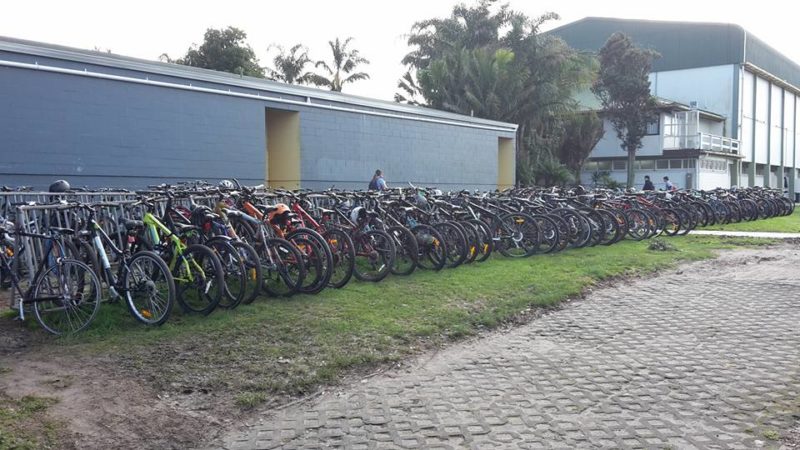
Meanwhile, on a winter day, the bike shed at Takapuna Grammar School looks like this – and that’s under current conditions. How can we account for the suppressed demand, of all those people who would bike if it was easier, safer, more connected?
With the council and local body elections approaching, you might want to do two things. First, make sure you’re registered to vote, quick! And next, start asking your candidates a few questions. Like:
- What’s your plan for Aucklanders on bikes?
- For Local Board candidates: will you prioritise creating greenways to make local trips easier and safer? What are your ideas for making our town centre and our schools more accessible and bike-friendly?
- For Councillor candidates: AT’s budget for cycling and walking is better than it used to be – but will you support the same or more funding for bikeways in the future?
Because it’s all very well to count things – now let’s make those things really count.

