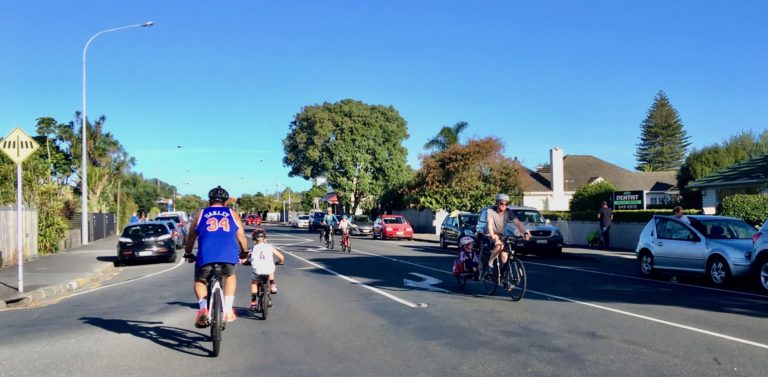
In April 2020, with the country in Level 4 lockdown and everyday traffic at an all-time low, Aucklanders took to the streets in astonishing numbers on wheels and on feet. Most striking was the sheer number and variety of people on bikes in our neighbourhoods. Young and old, rusty riders on dusted-off wheels, whole families heading out for fresh air, and all heeding the advice to “ride local.”
We knew we had to capture this moment. So halfway through lockdown, we launched the Big Backyard Bike Count – and asked you, the public, to help us count traffic movements in your ‘hood during Level 4. It went so well, we continued into Level 3.
Why we asked you to help us count bikes
A picture’s worth a thousand words – and boy did we gather some fabulous photos! – but we also needed data, for good reason:
- Auckland’s official cycling stats come from Auckland Transport’s 26 automatic bike counters. Half of these are in the central city, and the rest are dotted around on cycleways and leisure routes.
- Many, if not most bike trips – to school, to the shops, within and around neighbourhoods – never go anywhere near those counters.
- This means most local bike travel in Auckland is never counted at all. And that’s a problem, because the official statistics guide strategy and investment for our streets.
Let’s be clear: the existing data tells a powerful story. The automatic counters tell us that ridership grows wherever bike paths are built, improved, and connected (aka the “network effect”). So far, it’s largely a story of bikes as commuter transport. On the key cycleways to and through the city centre, weekdays are growing by leaps and bounds, increasingly outpacing weekends, and there are morning and afternoon rush hours (so it’s no surprise that those routes took on a different shape during lockdown). By contrast, at more peripheral cycle routes or along major sightseeing routes like Tamaki Drive, you often see stronger numbers on weekends and public holidays.
But we all know this is not the whole story. Nobody is counting the missing middle – the everyday, ordinary trips by everyday, ordinary people, including kids and elderly riders and blue-collar commuters and local shoppers.
All you Aucklanders who just get on your bikes and ride, where there aren’t any automatic bike counters? Unfortunately, you’re not counted.
And you’re just the tip of the iceberg. Research regularly tells us that at least 60% of the population would jump on a bike and ride – if it felt safe to do so. During lockdown, they did! Level 4 streets gave us a unique opportunity to see what it looks and feels like when that pent-up demand is unleashed. When the majority is given the freedom to choose how they move.
Never let it be said again that Aucklanders don’t want to bike. We do – and we will, whenever and wherever we feel safe to do so.
Where and what you counted
We asked, and you answered the call! Over the course of 5 weeks – covering the last three weeks of Level 4, and two weeks of Level 3 – we received 301 separate survey forms.
Each survey recorded traffic movements over a 15 minute period, which adds up to 75+ hours of volunteered counting time, as well as the time you took to observe the scene and send us your results. We hugely appreciate the effort you all put in to gather the data, and the accuracy and creativity you brought to the task. Especially people without printers at home, who went to impressive lengths to reproduce the official form!

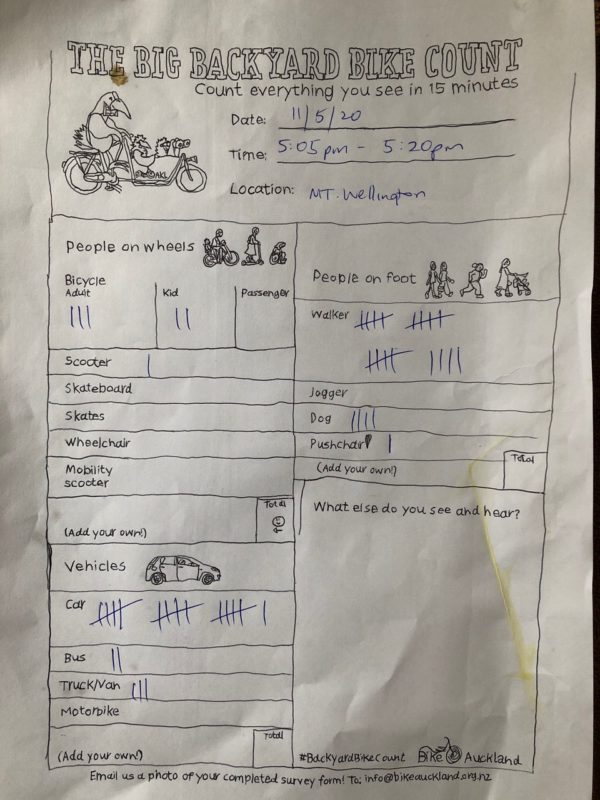
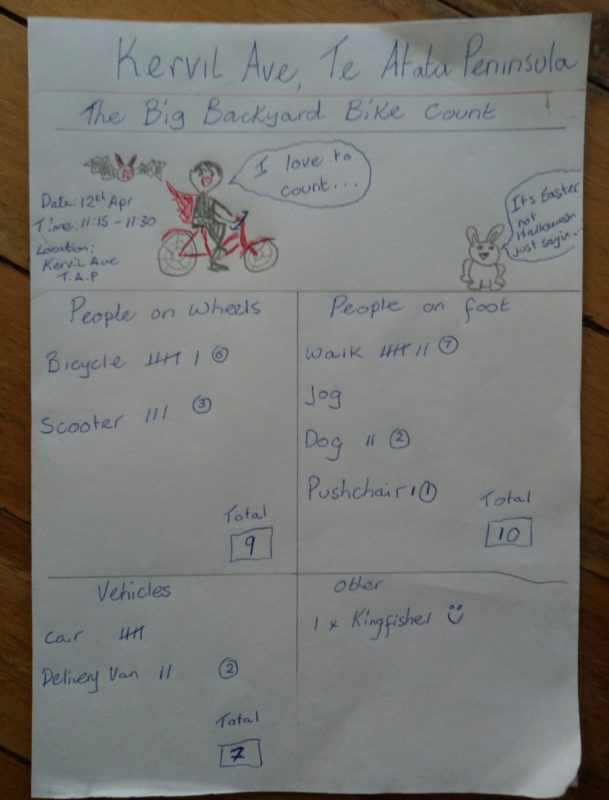


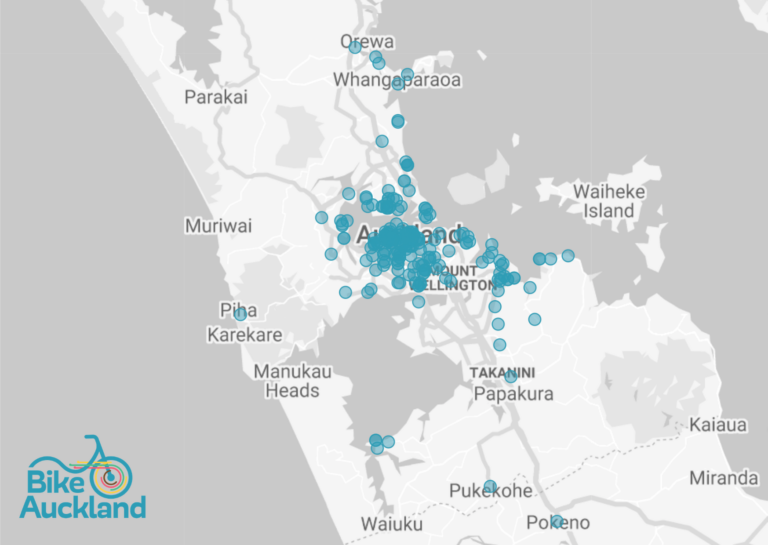
Geographically, you covered the city from Orewa to Pokeno! Of course, there are some gaps on the map. We’re especially conscious of the “two lockdowns” effect – in which some parts of the city enjoyed more leisure time, while others carried on with essential work. But we were glad to see counts coming in from all corners of the city, even where there weren’t swathes of bikes on the street. More data is good data.
We also noticed an uptick of responses in a couple of locations towards the end of the count, when some clever teachers picked up on the maths potential of the exercise for kids stuck at home!
The results, by the numbers
In total, over five weeks our army of human counters recorded 22,968 traffic movements, consisting of 3626 on bikes, 8307 on foot, and 11,035 in vehicles.
Note for clarity: “bikes” (aka ‘wheels’ on our survey form) includes a small percentage of scooters and skateboards; “pedestrians” includes people jogging, dog-walking, and in wheelchairs and pushchairs; and “vehicles” includes cars, trucks, buses, motorbikes, etc.
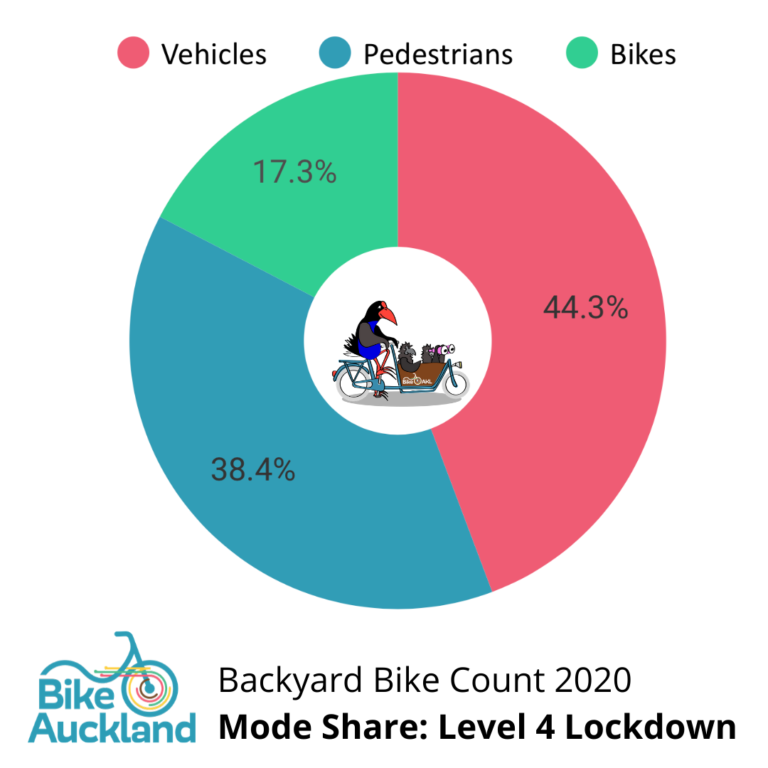
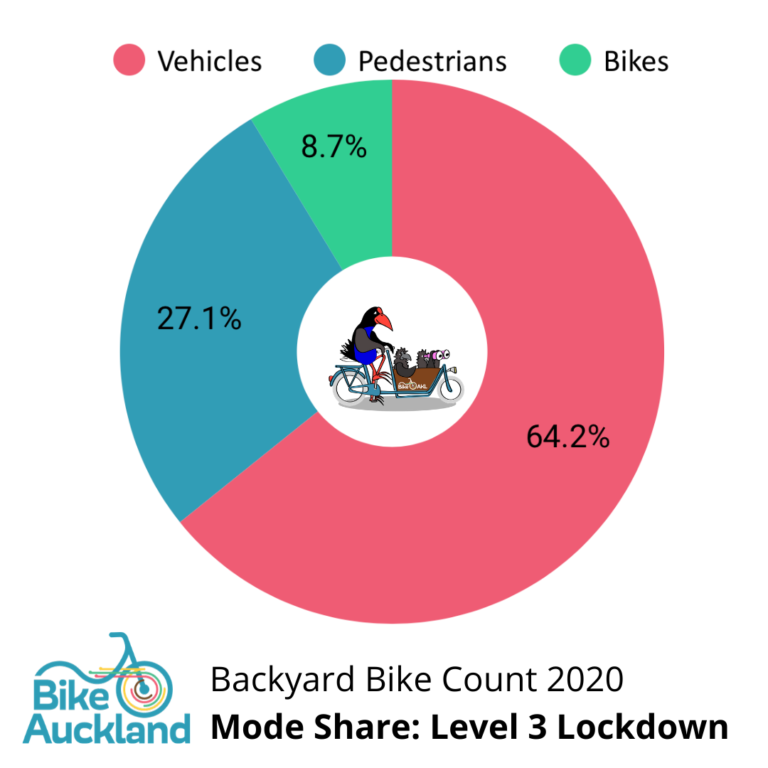
Matching the evidence of our eyeballs, our counters recorded the fact that people – on foot and on wheels – dominated the streets in Level 4 and Level 3. Here’s what that looked like, as average mode share across all locations over 5 weeks of counting.
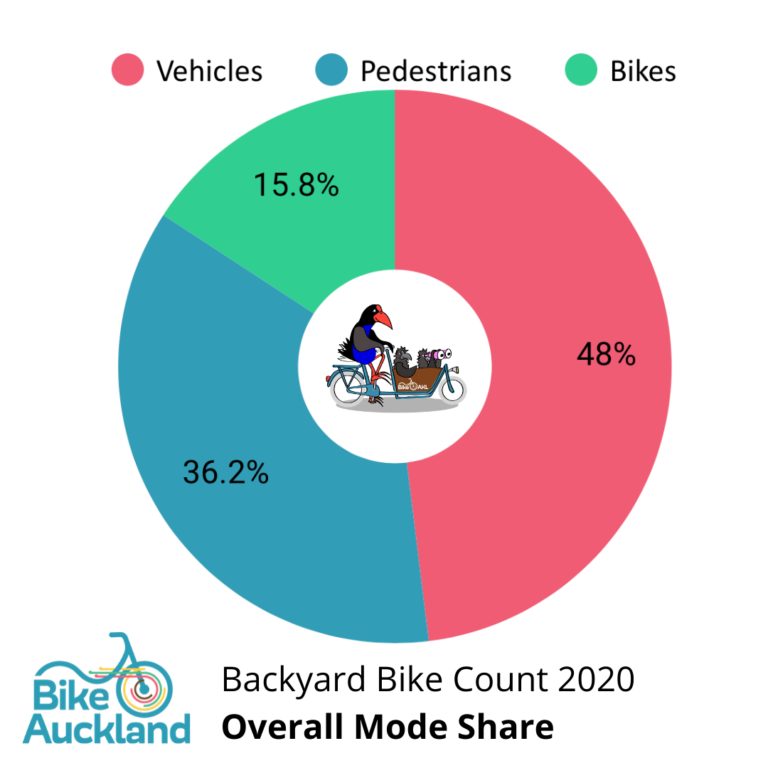
For comparison, according to the 2018 census around 59.5% of Aucklanders drive to work, 4.3% walk or jog, and on average 1% of Aucklanders bike to work – although there are bike hot-spots (e.g. along the Northwestern Cycleway) where the bike share runs to 4 or 5%. And for journeys to school or study, 21% usually walk, and 1.5% usually bike – although again there are neighbourhoods where, for example, kids bike to school in double-figures.
Clearly, over the period from deepest lockdown to Level 3, people on feet and wheels came out to fill the space: the majority of movements in neighbourhoods were people walking, jogging, and biking.
As expected, Level 4 – when vehicles were strictly limited to essential journeys only – saw the strongest numbers walking and biking. Our first surveys came in from very busy bike locations, so the early share of active transport was over 60%. As more returns came in from around the city, numbers settled at a solid majority of 55.7%.
Not unexpectedly, the mode share shifted again as the country moved from Level 4 to Level 3. You can see clearly that as traffic volumes came back, the proportion of people walking and biking dropped – even though there was the same need for fresh air, exercise, and local trips. (This was also where people started to note on their surveys that they wished there was a counting category for big SUVs and double-cab utes, as that was a significant feature of the returning traffic in local streets).
The results, in your own words
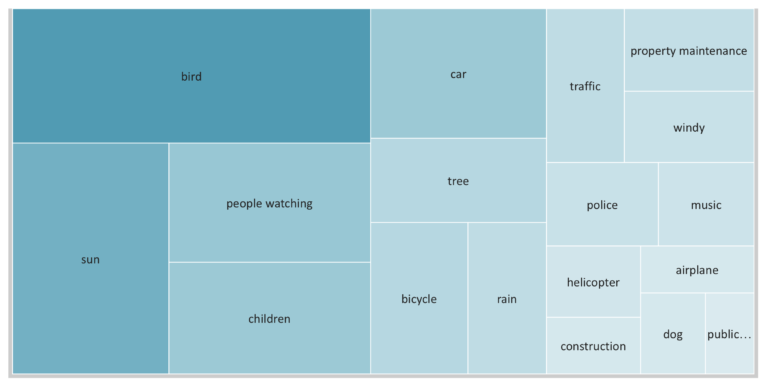
As well as observing the movements, we asked what else you noticed – what you could see, hear, and smell. People recorded all sorts of observations, with a few key themes: how quiet it was, how clean the air felt, the fact that you could hear and see people coming from far away, the fact there were so many children out and about, and above all, how you could suddenly hear the birds.
You can see that vividly in our word-trees, compiled from your observations.
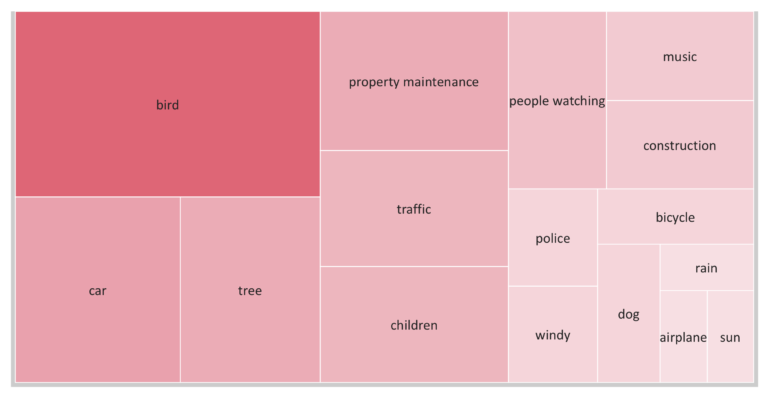
This overwhelming sense of peace and quiet (and nature and people) is confirmed by Women in Urbanism’s fascinating lockdown survey, notably entitled Life in A Low-Traffic Neighbourhood. There’s a clear correlation: with less traffic, neighbourhoods were more peaceful, more sociable, and more connected, with more options for streetlife. In short, low-traffic neighbourhoods are delightful. And kids love traffic-free streets.
It’s as if, in a reverse magic trick, we were suddenly able to see the powerful everyday effect of traffic on our senses and our freedom of movement, only at the moment it vanished.
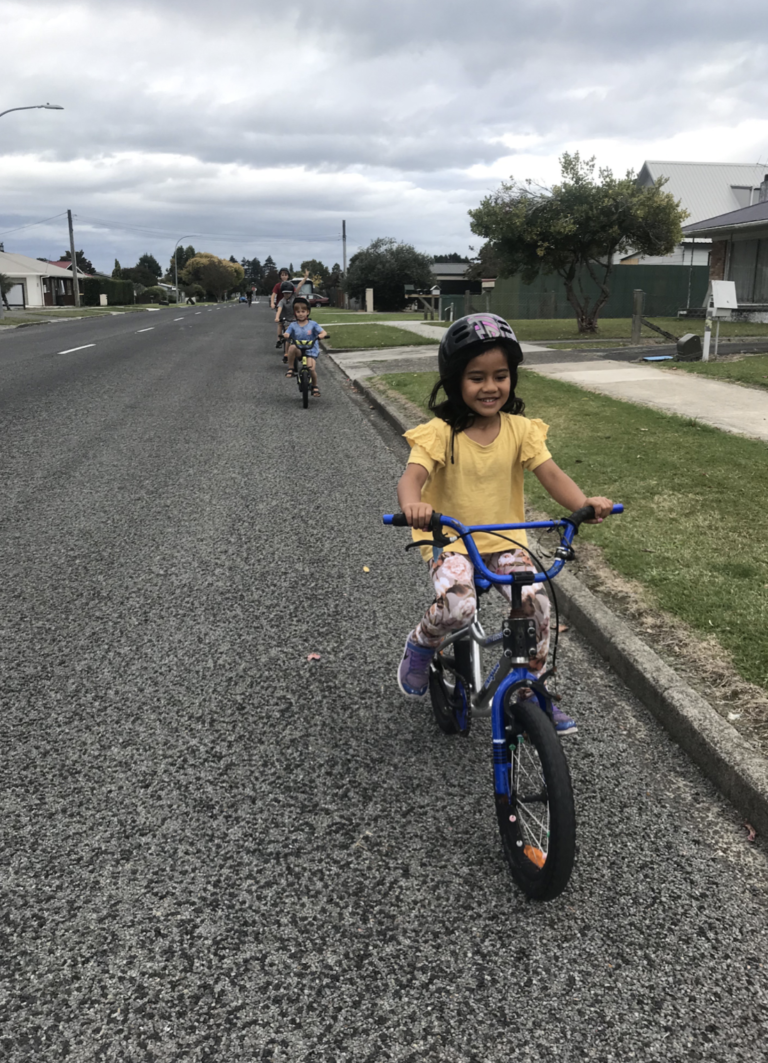
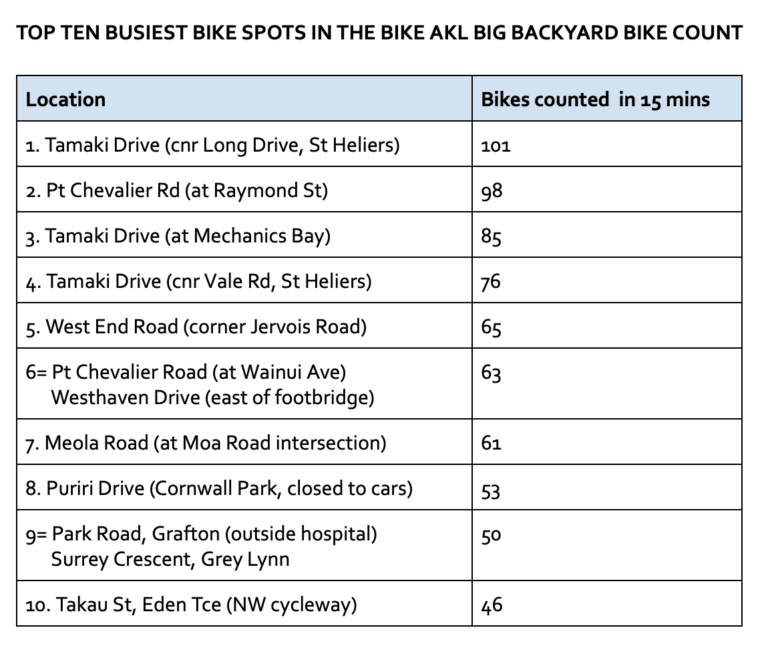
The top ten bike hot spots!
Another thing our local surveys revealed, especially useful in the absence of regular counts at street level, was the major “bike hot spots” around town.
No surprise that a buzzing Tamaki Drive was the clear leader, given its confirmed status as our busiest commute route in normal times, and our premiere waterfront boulevard for leisure and sightseeing at all times. It was a natural candidate for the pop-up emergency cycleway treatment late in Level 4, which offered a perfect opportunity to test the promise of the visionary and long-cherished Tamaki Drive Master Plan. (However, as we write, Auckland Transport has just removed the cones on Tamaki Drive, “now that physical distancing is no longer required.”)
The inner west burbs of Pt Chevalier and Grey Lynn also make a very strong showing, confirming the strategy of building out the inner-city bike network to connect this ready-to-bike population. (Unfortunately, as we write, the linked cycleway projects in these two areas – along with local connections for Glen Innes, Great North Road, the Mangere cycle route, and the Ngapipi section of Glen Innes to Tamaki Drive – are set to be delayed by yet another year, given the Covid-19 budget hole.)
It’s also powerful to see Park Road high on the list. This corridor runs past Auckland Hospital and the Domain and is a risky stretch with lots of buses and cars. It has long been in need of a protected bike lane, and will be a “gap on the map” between protected cycleways on Karangahape Road and Carlton Gore Road.
If Auckland was of a mind to build “keyworker corridors” to keep medical staff safe on their rides to work, Park Road would be a shoo-in, along with other routes used regularly by health workers. We regularly hear from riders who’ve had dangerous and stressful encounters along this stretch, and it was upsetting to learn of at least one further injury here during lockdown.
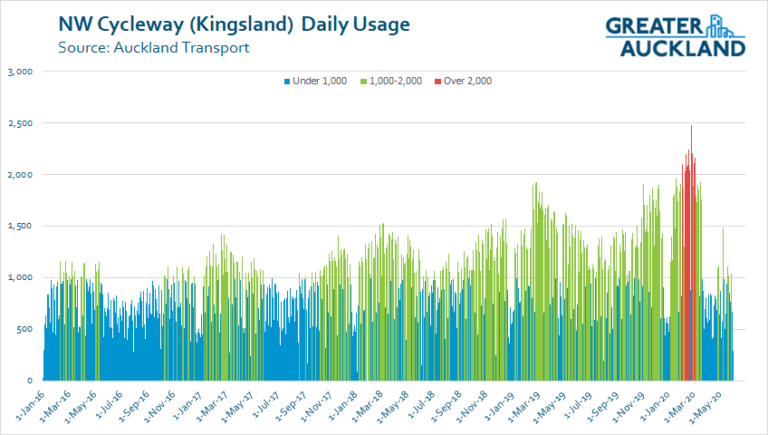
Interestingly, only one dedicated cycleway made it into the top ten – and only just. Takau St comprises a short part of the city end of the Northwestern Cycleway, with neighbours living close enough to observe the daily traffic. As AT’s automated counter shows, the Northwestern was quieter than usual during lockdown after a record-breaking run in March, but is already bouncing back.
Puriri Drive in Cornwall Park also made it into the top ten. Good on to the Cornwall Park Trust for trusting their instincts and keeping the park car-free during lockdown, and largely car-free since!
And, notably, there were several major arterial corridors that just missed the leaderboard: for example, Dominion Road, Ponsonby Road, Manukau Road, Lake Road (where some daily counts were up 100% over the same time last year). With protected bike lanes on these key routes, people of all ages could continue to use them to get places all over the city – to work, to school, to the shops, to visit nearby neighbourhoods. Lockdown gave us a taste of how easy that could be, and how great it could feel.
Top 5 things we learned from cycling in lockdown
1. Biking safely round the ‘hood with family and friends is a joyous experience. This came through so strongly in the photos, the videos, and the stories you sent us. And most of all in this gorgeous video made by journalist Tim Beveridge and his family.
2. People love low-traffic streets because they feel safer. Don’t just take it from us: here’s a Waka Kotahi/ NZTA survey from late April – when, in the last week of lockdown, a 5 point drop in general traffic coincided with a 9 point rise in people walking and biking. We don’t think that’s a coincidence.
3. Getting moving is good for us. It’s been noted that much of the riding and walking was “recreational” – as if that makes it somehow less meaningful, less important to plan around, more likely to evaporate.
But recreation was a huge part of what got us through lockdown. We may have joked about ‘State-Mandated Exercise’, but the state did mandate it: official advice was to stay home, but make sure you get your regular exercise. During the toughest two months we have faced as country in a lifetime, New Zealanders turned to walking and cycling to keep ourselves – healthy, mentally and physically.
In a very real way, what this data shows is that walking and cycling was a key part of our pandemic response. On top of that, it proves something we’ve long been told by surveys — New Zealanders want to be on bikes, and when they know they can bike safely, they will.
4. Local cycling transforms neighbourhoods. As well as giving heaps of people a fresh perspective on where they live (shout out to everyone who did a ‘Tour de Neighbourhood‘!), lockdown was a live demonstration of the ease of biking for the quick local trips that make up a majority of daily journeys in New Zealand. Shops, school, public transport: if it’s a fifteen minute walk, it’s a five minute bike ride.
Think of the overflowing school bike sheds of half a generation ago – and think of the “school holiday effect” on today’s traffic. Now imagine how empowering it will be, if we can shape our streets to tap this simple resource. With public health and climate action at emergency levels, local biking offers such enormous potential it would be criminal to ignore it.
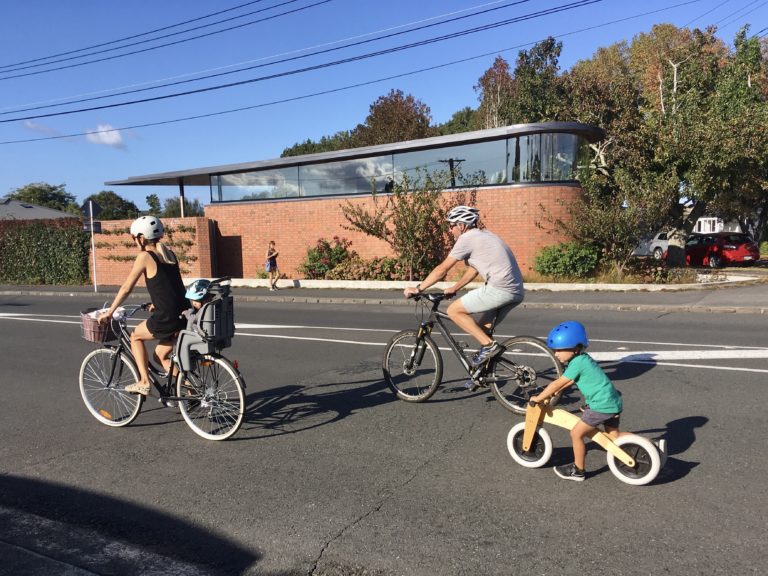
5. We’re ready for a change! Sure, the people we counted during lockdown were mainly walking and riding for fun and fresh air. At the same time, they were voting with their feet – and showing how quickly we can come to take for granted local cycling, calmer streets, more connected communities, better public health and happiness, and joyfully independent kids. What are we waiting for?
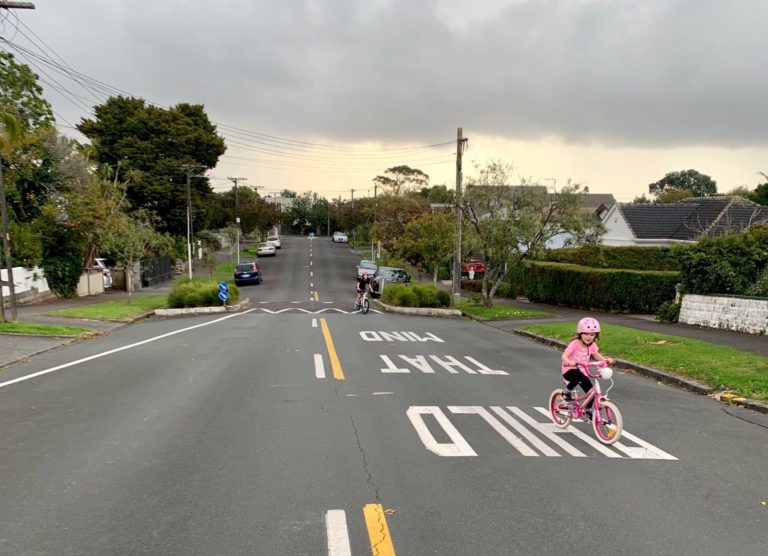
What next for the Backyard Bike Count, and these local revolutions?
The Backyard Bike Count was a resounding success in gathering the local data we need to make the case for bike-friendly neighbourhoods – whether it’s protected lanes on busy through-roads and shopping streets, school streets that prioritise kids walking, biking and scooting, or slower-speed filtered back streets with fewer cars.
We can see huge potential in sharing local data for local action, and in doing future counts, both at the city scale and at specific locations.
We’re also keen to think about how else we could shape our bike surveys to capture what’s really going on out there. For example, we didn’t specifically count e-bikes, but we’re curious what proportion of bikes they are on Auckland’s streets.
“The road is long but full of hope” is one of the mottos we lean on when thinking about how many years (decades!) we’ve been advocating for a bike-friendly city that’s good for all of us.
Within the stressful and uncertain context that made lockdown necessary, we weren’t alone in cherishing the silver lining of our suddenly safer streets. And for a brief shining moment there, it almost felt like the world had changed for good. How could anyone want to revert to a default traffic noise, hostile streets for kids, and neighbourhoods dominated by cars?
Life is now returning to a familiar “normal” that we know is precarious, unsustainable, and not good for us or the planet. But things have absolutely changed, and will keep changing. Bike sales are booming, to the point there are shortages; and e-bike sales are hitting record highs. A new fund for tactical urban transformations is drawing visionary bids from all over the country. And our shared experience of a gentler way of life will underpin our work for years to come.
Most importantly, this demonstration of a different world now shapes all of our calls to action. We used to have to ask you to imagine the possibilities. Now, you have a feeling of how close that future is.
Right now, Auckland Council is consulting on a radically reduced Emergency Budget, one that keeps signed contracts going at the cost of cuts to the cycling programme and road safety, at the risk of entrenching social and geographical inequity, and compounding the climate emergency. Imagine if we were to win the battle of keeping Covid-19 at bay, only to lose even more people to the everyday carnage on our roads.
Imagine if we squandered the joyful glimpse we’ve all been given of how kind our streets can be.
Let’s keep raising our voices for streets that are not just liveable – and not just survivable – but as lovable as they were during lockdown.
If you’re reading this before Friday 19 June 2020, head to our quick feedback guide to the Emergency Budget, and join the call to save cycling by building back better!
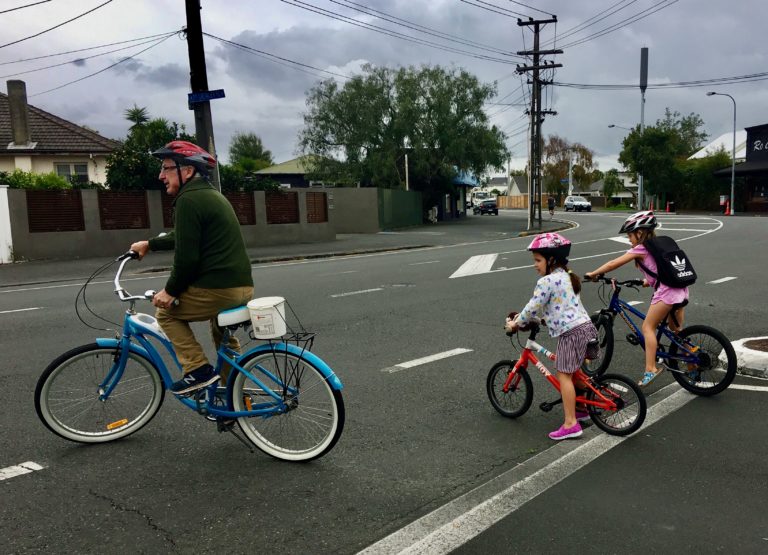
Thanks and congrats!
Thank you too everyone who counted, too many of you to name. And a special shout-out to our super-counters who sent multiple counts from the same location, or from several locations around the neighbourhood. We plan to take a closer look at your results to see what we can do in the way of hyper-local data-viz and future bike counts.
Thanks, too, to the teachers who picked up the bike count and ran with it as a maths exercise – and to those who turned it into a family bonding occasion, like Hanna:
It’s been such a lovely thing to do with my daughter – a home schooling exercise in statistics, how democracy works and social studies (aka people-watching). As well as a crash course in Excel when we decided to graph our own results. She’s 12 and it’s cool she wants to do it with me. So thank you for that gift.
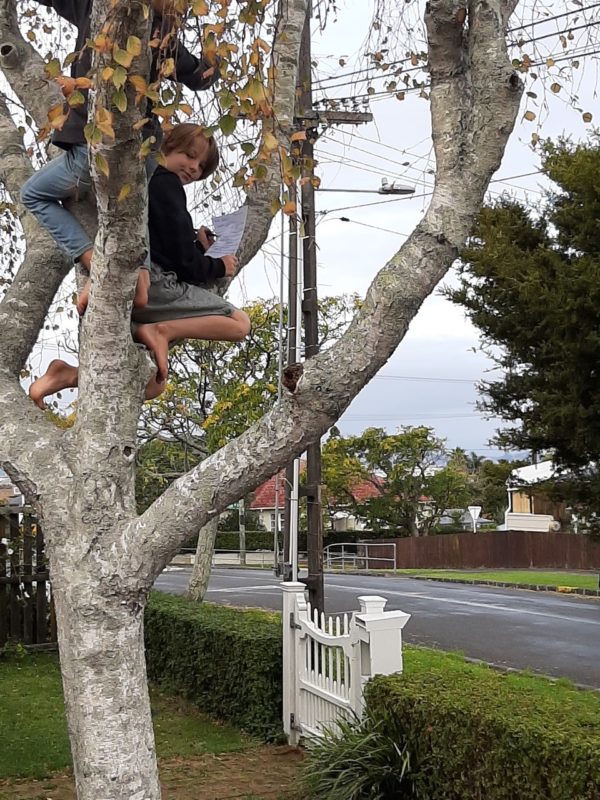
It wasn’t just the lengths you went to – it was also the heights, like these guys in Onehunga! On that note, thanks to everyone who sent us photos along with your survey forms. We loved seeing this very different world through your eyes.
Lockdown Streetlife Stories, a sampler
- “Let’s Never Go Back to Normal”, Sam McGlennon, Newsroom, 26 March 2020
- “Lockdown has made me see my neighbourhood in a new light”, Lorna Thornber, Stuff, 4 April 2020
- “Enjoying the people friendly streets of lockdown? Let’s make them permanent”, Emma McInnes, The Spinoff, 16 April 2020
- “Big biking boom: Kiwis turn to other modes of travel and fun during lockdown”, Rebecca Moore, One News, 27 April 2020
- “Cycling popularity changes gear during Lockdown”, Harry Lock, RNZ, 29 April 2020
- “Health and climate benefit fromAuckland’s ‘pandemic surge’ in cycling and walking during lockdown”, Michael Neilson, NZ Herald, 4 May 2020
- “Will bikes replace cars as Kiwis leave lockdown?” The Project, 13 May 2020
- “Lockdown gave us an experience of Mason Durie’s Te Pae Māhutonga”, Robin Kearns, University of Auckland, 3 June 2020
- Life in a Low-Traffic Neighbourhood: Kirsty Wild, Women in Urbanism, June 2020.


